The models of Thomas Lux (1997, 1998, Lux & Marchesi, 1999,
2000) are multi-agent (without individual agents !) simulations of financial
markets. Lux purpose is to replicate the statistic stylized facts observed in
real markets, namely :
- Fat tails (series are leptokurtic)
- Volatility clustering (large fluctuations are followed by large
fluctuations) and even...
- The hyperbolic decay of the volatility autocorrelation ( the
so-called long memory property).
These features of financial data imply that the probability distribution
function is highly non-gaussian. This simulation shows that with gaussian
information arrivals, and a market composed of heterogeneous agents who switch
between different strategies, the price exhibits the characteristics of real
data.
The Model
This kind of model is used by an increasing number of authors, see, e.g.
Youssefmir and Huberman [1997] and Kirman [1993] among others. In a complex
environment, adaptive agents continuously switch between different strategies,
influenced in their decisions by the interactions with other investors. The
population of investors is divided into two groups, chartists (using past
data to infer future price) and fundamentalists (they trade only on
information). The chartist group is also divided in two sub-groups, the "optimistics",
who extrapolate the price trend (positive feedback trading) and the "pessimistics"
who believe that the price will revert (negative feedback trading, the so-called
"contrarian" strategy). In this setting, agents compare profits
obtained with these different strategies. As the chartist profits depends on a
opinion index, mimetism is introduced. This leads to large waves of optimism and
pessimism. Readers may refer to the different articles of Lux to understand the
transition probabilities between different strategies of trading.
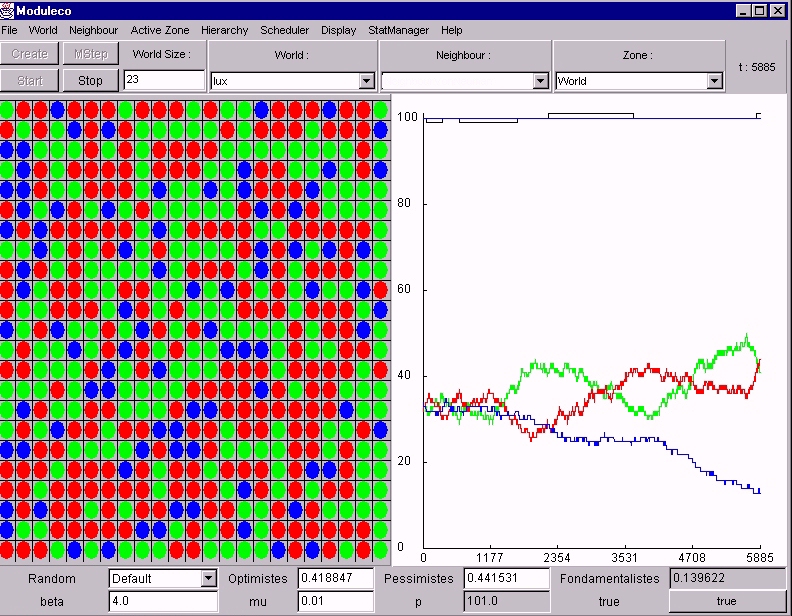
Note : in Moduleco, the right-part graph represents the
evolution of the market price (which is arbitrarily fixed to 100 at the
beginning, and is equal to the fundamental price) and the fractions of different
groups, namely, blue for fundamentalists, green for optimistics and red for
pessimistics.
note writing by Nicolas
Boitout, Sebastien Chivoret, Thierry
Delahaut
- Kirman A. [1993], ' Ants, rationality and recruitment', Quarterly
Journal of Economics, Volume 108
- Lux T. [1997], 'The socio-economic dynamics of speculative markets:
interacting agents, chaos, and the fat tails of return distributions, Journal
of Economic Behavior & Organization, Volume 33
- Lux. T [1998], 'Time variation of second moments from a noise
trader/infection model, Journal of Economic Dynamics and Control,
Volume 22, Issue 1
- Lux T., M. Marchesi [1999], 'Scaling and criticality in a
stochastic multi-agent model of financial market', Nature vol. 397 pp
498 - 500
- Lux T., M. Marchesi [2000], 'Volatility clustering in financial
markets: a microsimulation of interacting agents, International Journal
of Theoretical and Applied Finance
- Youssefmir M., B. A. Huberman [1997],'Clustered volatility in
multiagent dynamics', Journal of Economic Behavior & Organization,
Volume 32, Issue 1
Denis.Phan@enst-bretagne.fr
; Antoine
Beugnard@enst-bretagne.fr